Report Settings Guide
After the user creates a test paper, the candidate report settings, including the content of the examination and category suggestion, can be made, which gives the candidate more suggestions and helps the candidate improve his or her ability in all aspects.
There are two parts in Report Setting: "Of examining paper" and "Category Suggestion."
Ⅰ. Description of Examining Goal
In this place, you can add the goal of the exam, and add description texts to the exam. (as shown in the figure)
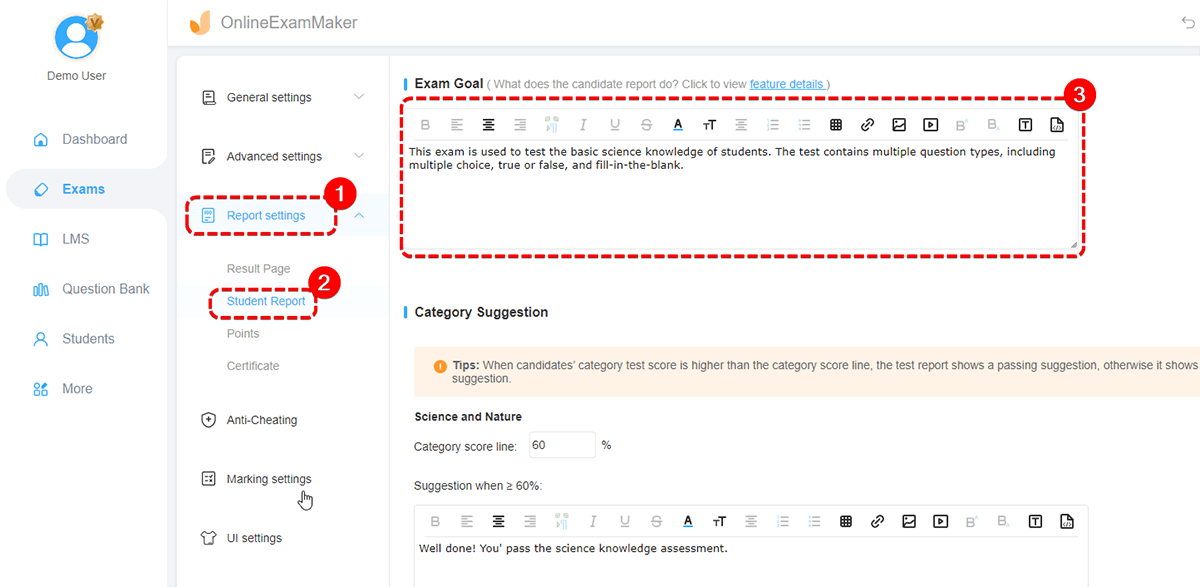
Ⅱ. Category Suggestion Settings
Users need to set the pass score percentage for each category, and set recommendations for candidates both passing the exam or not, when the candidate’s test score is higher than the set pass score, the pass recommendation is displayed, otherwise the fail recommendation will be displayed.
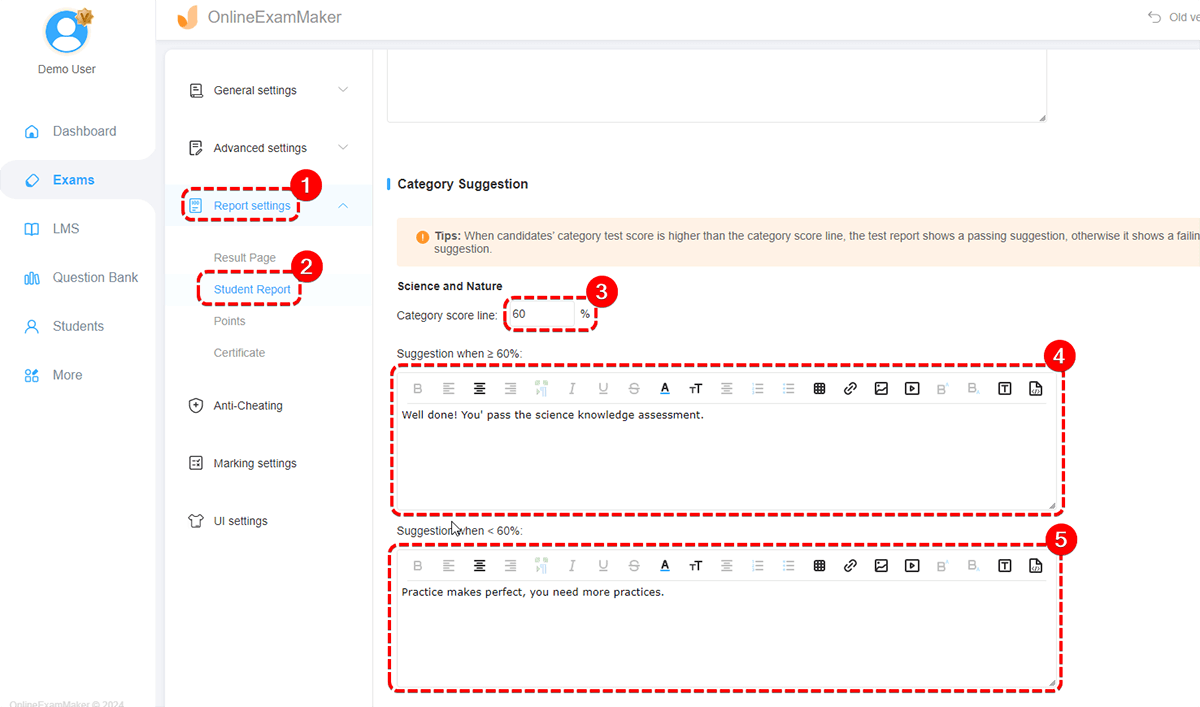
Tips:
(1) Pass Suggestion: you can express your affirmation and encouragement to the candidates that pass the exam.
(2) Fail Suggestion: you can point out the knowledge points examined and provide the candidates with your suggestions to help them improve.
Ⅲ. Turn on allowing candidates to view candidate reports
The administrator needs to tick the box of "Show exam taker report link" in the "Result Page" settings.
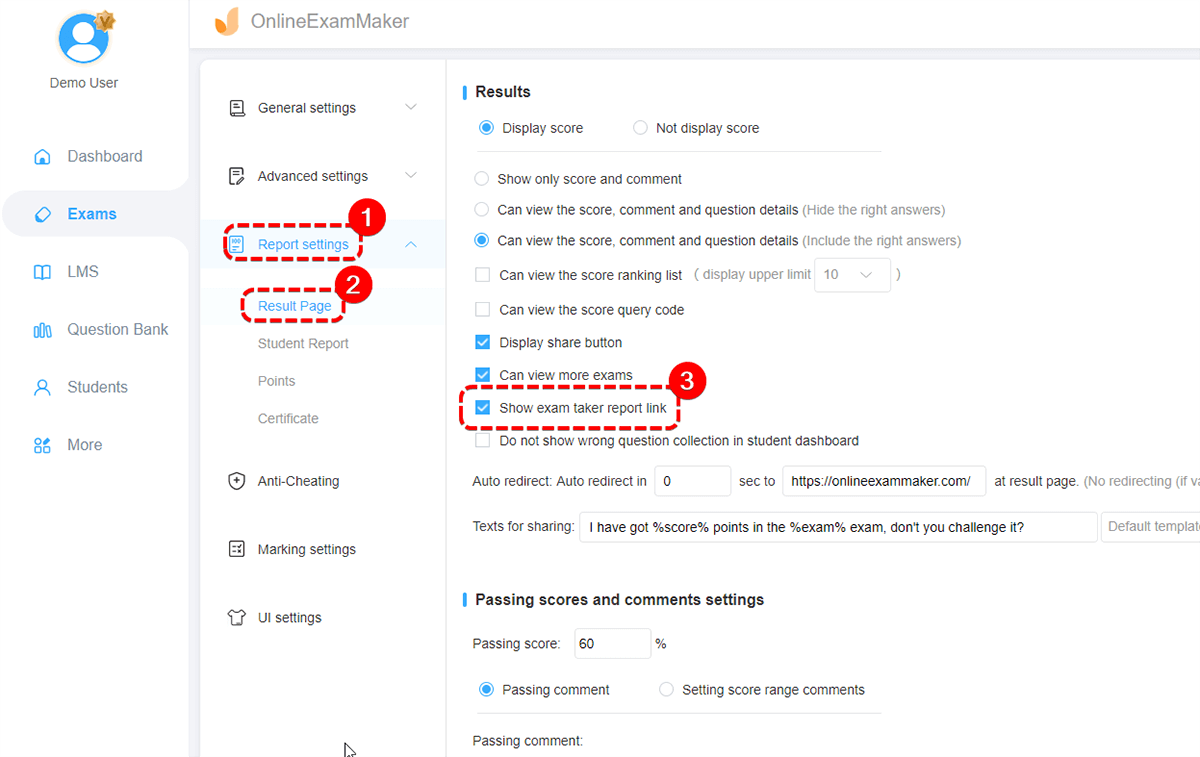
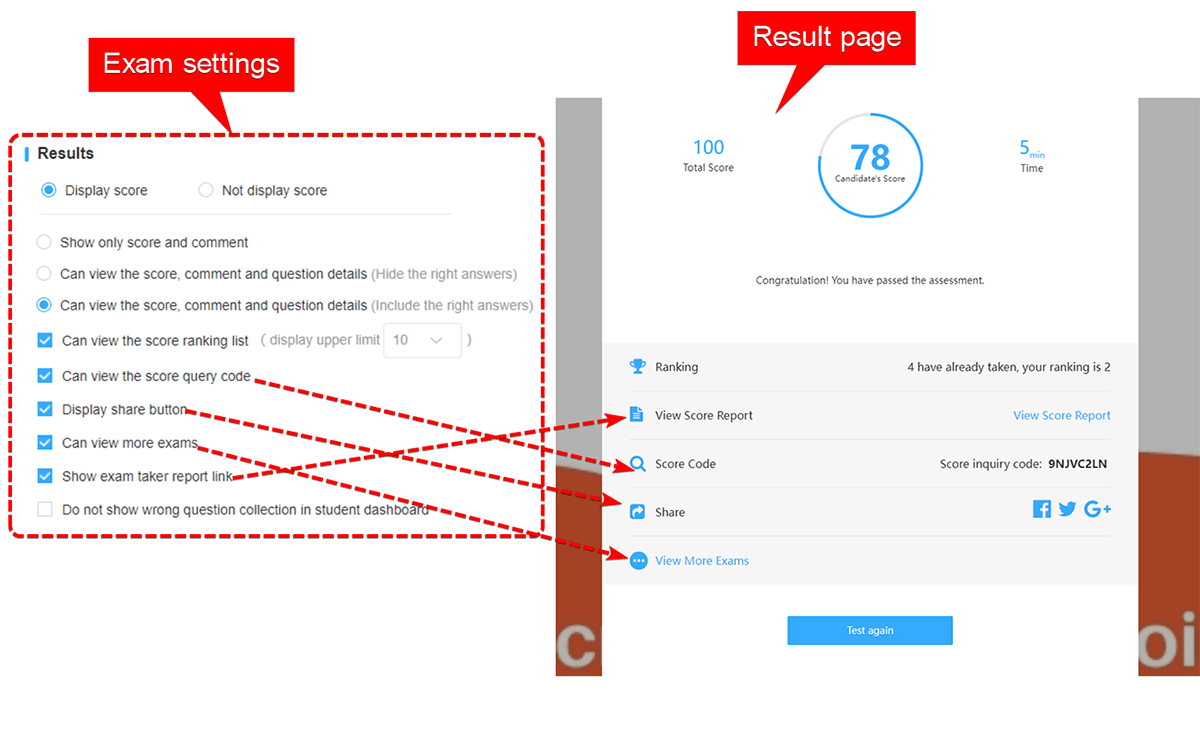
When the examination paper is submitted and scored, the candidate can also view the candidate’s report through the link;
The administrator can also view the exam report by clicking into the exam’s "Statistics" and click on the "View records" and then the icon "Exam report" can be seen.
Ⅳ. Candidate Report Content
In addition to showing the exam score, duration, candidate’s personal information, etc. , there are mainly four parts in the exam report:
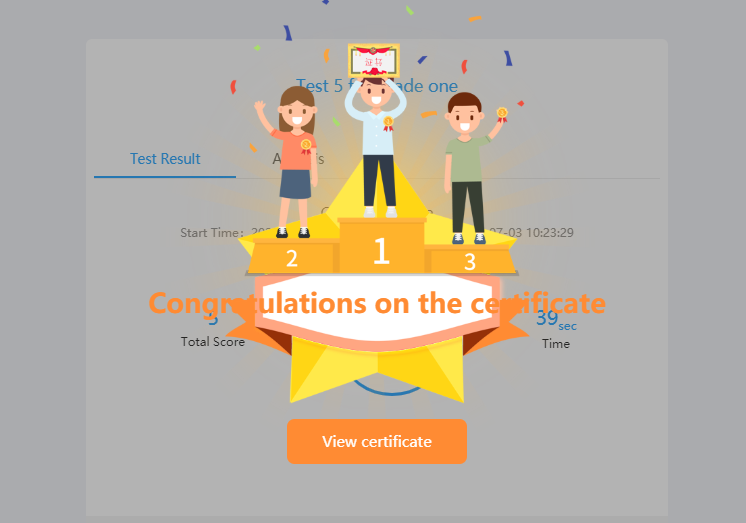
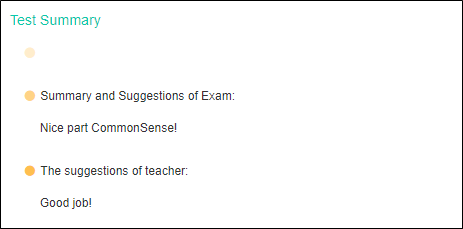
- Test Summary
After the paper is submitted and scored, the candidates can view the exam report and can also receive the suggestions from the administrators.
- Details of Answer
The details of categories record will be displayed in the form of a table, which includes category, total number of questions, the number of the wrong questions and right questions, score and correct rate.
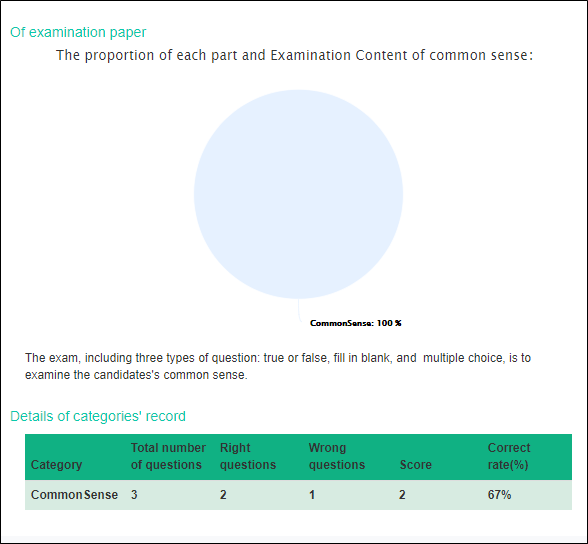
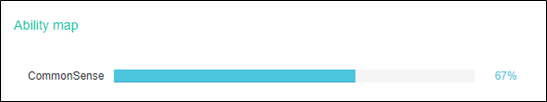
- Ability Map
Show the percentage of each category in a bar chart, allowing candidates to clearly see their strengths and weaknesses.
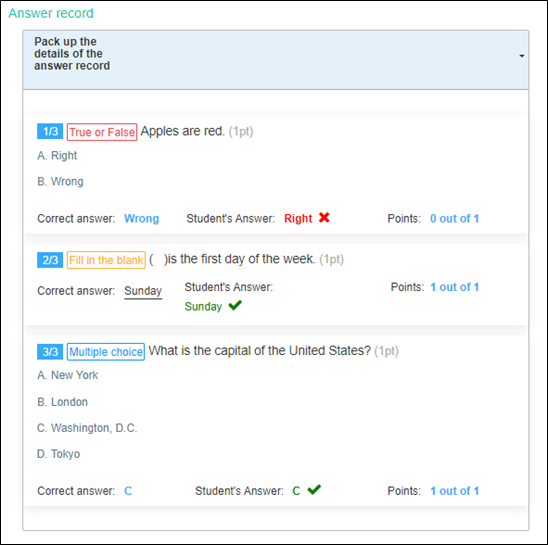
- Answer Record
If you need to view a detailed answer record, you can also expand the answer record.