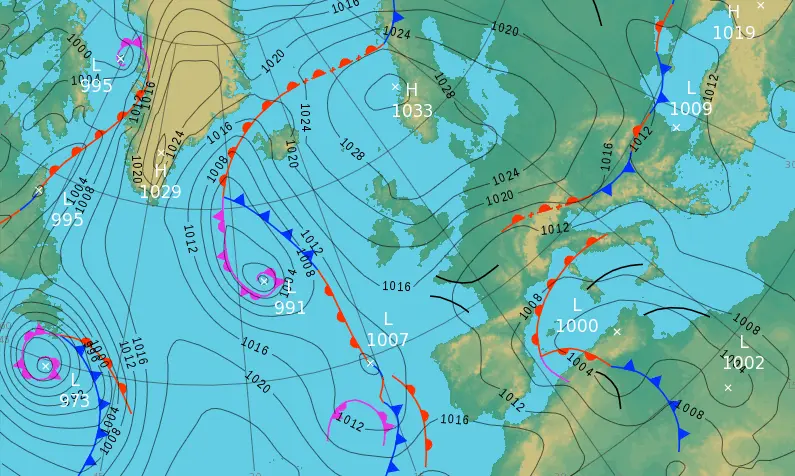
A synoptic chart is a detailed weather map that provides a snapshot of atmospheric conditions across a large geographical area at a specific time. It displays isobars, which are lines connecting points of equal atmospheric pressure, revealing high and low-pressure systems that influence weather patterns. Fronts, such as cold, warm, and occluded fronts, are marked to indicate boundaries between differing air masses, often leading to changes in temperature, humidity, and precipitation. The chart may also include isotherms for temperature variations, wind barbs for direction and speed, and symbols for cloud cover, rainfall, or storms. Meteorologists rely on these charts to analyze and predict weather systems, offering insights into large-scale atmospheric dynamics.
Table of contents
- Part 1: OnlineExamMaker AI quiz maker – Make a free quiz in minutes
- Part 2: 20 synoptic chart quiz questions & answers
- Part 3: Try OnlineExamMaker AI Question Generator to create quiz questions
Part 1: OnlineExamMaker AI quiz maker – Make a free quiz in minutes
What’s the best way to create a synoptic chart quiz online? OnlineExamMaker is the best AI quiz making software for you. No coding, and no design skills required. If you don’t have the time to create your online quiz from scratch, you are able to use OnlineExamMaker AI Question Generator to create question automatically, then add them into your online assessment. What is more, the platform leverages AI proctoring and AI grading features to streamline the process while ensuring exam integrity.
Key features of OnlineExamMaker:
● Create up to 10 question types, including multiple-choice, true/false, fill-in-the-blank, matching, short answer, and essay questions.
● Build and store questions in a centralized portal, tagged by categories and keywords for easy reuse and organization.
● Automatically scores multiple-choice, true/false, and even open-ended/audio responses using AI, reducing manual work.
● Create certificates with personalized company logo, certificate title, description, date, candidate’s name, marks and signature.
Automatically generate questions using AI
Part 2: 20 synoptic chart quiz questions & answers
or
1. What is the primary purpose of a synoptic chart in meteorology?
A. To show earthquake zones
B. To display atmospheric conditions over a wide area
C. To map river flows
D. To illustrate soil types
Answer: B
Explanation: Synoptic charts provide a snapshot of weather elements like pressure systems, fronts, and temperatures at a specific time, aiding in weather forecasting.
2. On a synoptic chart, what do isobars represent?
A. Lines of equal temperature
B. Lines of equal pressure
C. Lines of equal humidity
D. Lines of equal wind speed
Answer: B
Explanation: Isobars connect points of equal atmospheric pressure, helping to identify high and low-pressure systems and wind patterns.
3. Which symbol on a synoptic chart indicates a cold front?
A. A line with triangles
B. A line with semicircles
C. A line with alternating triangles and semicircles
D. A dashed line
Answer: A
Explanation: Triangles pointing in the direction of movement represent a cold front, where cooler air replaces warmer air.
4. What does a high-pressure system on a synoptic chart typically indicate?
A. Stormy weather
B. Clear skies and stable conditions
C. Heavy rainfall
D. Rapid temperature drops
Answer: B
Explanation: High-pressure systems are associated with descending air, which leads to fair weather, clear skies, and light winds.
5. In a synoptic chart, how are warm fronts depicted?
A. With triangles
B. With semicircles
C. With circles
D. With squares
Answer: B
Explanation: Semicircles on the side of the front’s direction indicate a warm front, where warmer air advances and often brings prolonged precipitation.
6. What weather is commonly associated with an occluded front on a synoptic chart?
A. Clear and sunny conditions
B. Intense thunderstorms
C. Steady rain or snow
D. Dry and windy conditions
Answer: C
Explanation: Occluded fronts occur when a cold front overtakes a warm front, leading to lifting of moist air and widespread, steady precipitation.
7. On a synoptic chart, the spacing of isobars indicates what?
A. Temperature gradients
B. Wind speed
C. Humidity levels
D. Cloud cover
Answer: B
Explanation: Closer isobars signify a steeper pressure gradient, which results in stronger winds, while wider spacing indicates lighter winds.
8. What does the letter “H” represent on a synoptic chart?
A. A hurricane
B. A high-pressure center
C. A heatwave
D. A hailstorm
Answer: B
Explanation: “H” marks the center of a high-pressure system, indicating areas of sinking air and generally fair weather.
9. How are stationary fronts shown on a synoptic chart?
A. With alternating triangles and semicircles
B. With a line of dots
C. With a straight line and no symbols
D. With semicircles on both sides
Answer: A
Explanation: Stationary fronts are depicted with alternating triangles and semicircles, indicating little movement and potential for prolonged weather.
10. What is the typical wind direction around a low-pressure system on a synoptic chart in the Northern Hemisphere?
A. Clockwise and outward
B. Counterclockwise and inward
C. Straight lines
D. Random patterns
Answer: B
Explanation: In the Northern Hemisphere, winds around a low-pressure system rotate counterclockwise and converge inward due to the Coriolis effect.
11. On a synoptic chart, what do shaded areas often represent?
A. Areas of high elevation
B. Precipitation or cloud cover
C. Wind directions
D. Temperature inversions
Answer: B
Explanation: Shading is used to indicate regions of rainfall, snowfall, or dense cloud cover based on weather data.
12. What factor determines the strength of a pressure system on a synoptic chart?
A. The number of fronts
B. The central pressure value
C. The color of the lines
D. The date of the chart
Answer: B
Explanation: Lower central pressure in a low-pressure system or higher in a high-pressure system indicates greater intensity and potential weather impacts.
13. How does a synoptic chart help in predicting fog?
A. By showing wind patterns only
B. By indicating high temperatures
C. By displaying dew point and temperature proximity
D. By mapping ocean currents
Answer: C
Explanation: When temperature and dew point are close on a synoptic chart, it suggests conditions favorable for fog formation due to high humidity.
14. What symbol might indicate a trough on a synoptic chart?
A. A dashed line
B. A solid circle
C. A wavy line
D. A straight arrow
Answer: A
Explanation: Dashed lines often represent troughs, which are elongated areas of low pressure that can enhance storm development.
15. In the Southern Hemisphere, how do winds circulate around a low-pressure system on a synoptic chart?
A. Clockwise and inward
B. Counterclockwise and outward
C. Clockwise and outward
D. Randomly
Answer: A
Explanation: Due to the Coriolis effect in the Southern Hemisphere, winds around a low-pressure system circulate clockwise and converge inward.
16. What does a synoptic chart use to show wind speed and direction?
A. Arrows with feathers
B. Colored dots
C. Number labels
D. Shaded regions
Answer: A
Explanation: Wind barbs or arrows with feathers indicate both the direction and speed of wind on the chart.
17. How are isotherms represented on a synoptic chart?
A. As dotted lines
B. As lines connecting points of equal temperature
C. As circles around pressure centers
D. As shaded bands
Answer: B
Explanation: Isotherms are lines that connect locations with the same temperature, helping to visualize temperature gradients.
18. What might a synoptic chart reveal about an approaching storm?
A. Only the storm’s name
B. Pressure changes and front movements
C. Daily high temperatures
D. Lunar phases
Answer: B
Explanation: By tracking falling pressure and advancing fronts, synoptic charts can indicate the approach and intensity of storms.
19. On a synoptic chart, what is the significance of a closed low?
A. It indicates calm weather
B. It represents a fully enclosed area of low pressure, often linked to cyclones
C. It shows high humidity only
D. It marks a temperature high
Answer: B
Explanation: A closed low is a circular low-pressure system that can develop into severe weather events like cyclones or depressions.
20. How do synoptic charts assist in aviation?
A. By showing flight paths
B. By providing data on turbulence, icing, and visibility
C. By mapping airports
D. By indicating fuel levels
Answer: B
Explanation: Synoptic charts offer critical weather information like wind, pressure, and fronts, which pilots use to avoid hazards and plan safe flights.
or
Part 3: Try OnlineExamMaker AI Question Generator to create quiz questions
Automatically generate questions using AI