What Are Website Heatmaps?
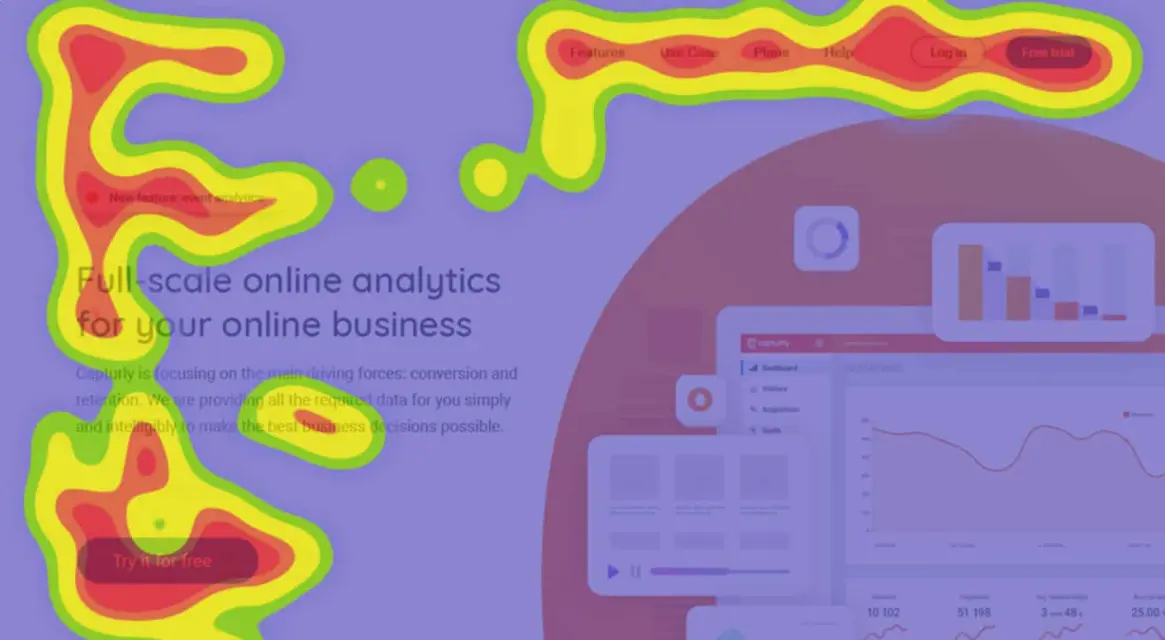
Website heatmaps are visual tools that display user interactions on a webpage using colors to represent data intensity. They help identify high-engagement areas, such as clicks, scrolls, or mouse movements, providing insights into user behavior.
Types of Heatmaps
Click Heatmaps: Show where users click most frequently, highlighting interactive elements like buttons or links.
Scroll Heatmaps: Illustrate how far users scroll down a page, revealing content visibility and drop-off points.
Mouse Movement Heatmaps: Track cursor paths to indicate attention and hover behaviors.
Eye-Tracking Heatmaps: Based on user gaze data, these map where eyes focus, often used in usability testing.
How Heatmaps Work
Heatmaps are generated by collecting data from user sessions via tracking tools. Software analyzes this data and overlays color gradients—typically red for high activity and blue for low—on the webpage layout.
Benefits of Using Heatmaps
Improve User Experience: Identify pain points and optimize layouts for better navigation.
Boost Conversion Rates: Focus on high-interaction areas to enhance calls-to-action and content placement.
Inform Design Decisions: Provide data-driven insights for A/B testing and redesigns.
Enhance SEO and Content Strategy: Understand which sections engage users longest, aiding in content prioritization.
Table of contents
- Part 1: OnlineExamMaker – Generate and share website heatmaps quiz with AI automatically
- Part 2: 20 website heatmaps quiz questions & answers
- Part 3: Automatically generate quiz questions using AI Question Generator
Part 1: OnlineExamMaker – Generate and share website heatmaps quiz with AI automatically
OnlineExamMaker is a powerful AI-powered assessment platform to create auto-grading website heatmaps assessments. It’s designed for educators, trainers, businesses, and anyone looking to generate engaging quizzes without spending hours crafting questions manually. The AI Question Generator feature allows you to input a topic or specific details, and it generates a variety of question types automatically.
Top features for assessment organizers:
● Prevent cheating by randomizing questions or changing the order of questions, so learners don’t get the same set of questions each time.
● AI Exam Grader for efficiently grading quizzes and assignments, offering inline comments, automatic scoring, and “fudge points” for manual adjustments.
● Embed quizzes on websites, blogs, or share via email, social media (Facebook, Twitter), or direct links.
● Handles large-scale testing (thousands of exams/semester) without internet dependency, backed by cloud infrastructure.
Automatically generate questions using AI
Part 2: 20 website heatmaps quiz questions & answers
or
1. What is a website heatmap primarily used for?
A. To track server performance
B. To visualize user interactions on a page
C. To monitor website traffic sources
D. To optimize search engine rankings
Answer: B
Explanation: A website heatmap is a tool that visually represents data such as clicks, scrolls, or mouse movements to show how users engage with a page, helping designers identify popular and neglected areas.
2. Which type of heatmap focuses on where users click the most?
A. Scroll heatmap
B. Click heatmap
C. Eye-tracking heatmap
D. Movement heatmap
Answer: B
Explanation: A click heatmap highlights areas of a webpage where users most frequently click, indicating which elements attract attention and which might be ignored.
3. What does a red area typically indicate on a click heatmap?
A. Low user interaction
B. High user interaction
C. Error zones on the page
D. Areas with no data
Answer: B
Explanation: In a click heatmap, red areas represent high levels of user clicks, suggesting that these sections are engaging or confusingly interactive.
4. How can heatmaps help improve website conversion rates?
A. By increasing page load speed
B. By identifying and optimizing high-engagement areas
C. By reducing the number of pages
D. By blocking unwanted traffic
Answer: B
Explanation: Heatmaps reveal user behavior patterns, allowing designers to optimize layouts and calls-to-action in high-engagement zones to boost conversions.
5. Which tool is commonly used to create website heatmaps?
A. Google Analytics
B. Hotjar
C. Adobe Photoshop
D. WordPress
Answer: B
Explanation: Hotjar is a popular tool that provides heatmaps to track user behavior, making it easier to analyze interactions without complex setup.
6. In a scroll heatmap, what does a gradient from green to red usually signify?
A. From mobile to desktop views
B. From low to high scroll depth
C. From old to new content
D. From text to images
Answer: B
Explanation: A scroll heatmap uses colors like green to red to show scroll depth, with red indicating areas where fewer users scroll, helping identify content drop-off points.
7. What is a key limitation of eye-tracking heatmaps?
A. They require physical hardware
B. They only work on mobile devices
C. They are free to use
D. They update in real-time
Answer: A
Explanation: Eye-tracking heatmaps often need specialized equipment or software to track actual eye movements, making them less accessible than click-based heatmaps.
8. How do heatmaps differ from traditional web analytics?
A. Heatmaps focus on visual data, while analytics emphasize numerical metrics
B. Heatmaps are only for e-commerce sites
C. Analytics provide visual data exclusively
D. There is no difference
Answer: A
Explanation: Heatmaps offer a visual representation of user interactions, whereas traditional analytics provide quantitative data like page views, complementing each other for deeper insights.
9. What is the main benefit of using heatmaps in A/B testing?
A. To compare server speeds
B. To visualize differences in user behavior between variants
C. To automate content updates
D. To track email campaigns
Answer: B
Explanation: Heatmaps allow comparison of how users interact with different page versions in A/B testing, revealing which design performs better.
10. Which color is often used to represent minimal activity in a heatmap?
A. Red
B. Blue
C. Yellow
D. Green
Answer: B
Explanation: Blue typically indicates low activity or interaction in heatmaps, contrasting with warmer colors like red for high activity.
11. How can heatmaps assist in mobile website optimization?
A. By analyzing battery usage
B. By showing touch interactions and scroll patterns
C. By checking internet speed
D. By monitoring app downloads
Answer: B
Explanation: Heatmaps display where users tap or scroll on mobile devices, helping optimize layouts for better touch-based experiences.
12. What does a heatmap reveal about user engagement on a long-form article page?
A. The author’s writing style
B. How far users scroll and which sections they read
C. The page’s font size
D. Social media shares
Answer: B
Explanation: A scroll heatmap specifically shows engagement depth, indicating if users read the entire article or drop off early.
13. Why might a website designer use a movement heatmap?
A. To track keyboard inputs
B. To observe mouse movements and hover patterns
C. To measure page load times
D. To analyze audio interactions
Answer: B
Explanation: Movement heatmaps track cursor or finger movements, revealing user interest and potential confusion points before clicks occur.
14. In heatmap analysis, what could cause “dead zones” on a page?
A. Overly bright colors
B. Areas with no user interaction
C. High-traffic keywords
D. Fast-loading images
Answer: B
Explanation: Dead zones are sections with little to no clicks or scrolls, often indicating irrelevant or poorly placed content that needs redesign.
15. How do heatmaps contribute to improving accessibility on websites?
A. By adding more buttons
B. By highlighting areas that users with disabilities might miss
C. By changing the website’s language
D. By increasing font sizes automatically
Answer: B
Explanation: Heatmaps can show if certain elements are overlooked, helping designers ensure that accessible features, like alt text or keyboard navigation, are effectively placed.
16. What is a common challenge when interpreting heatmap data?
A. Over-reliance on visual cues without context
B. Data is always inaccurate
C. Heatmaps work only at night
D. They require no analysis
Answer: A
Explanation: Heatmaps provide visual data that can be misleading if not combined with other metrics, as colors might not account for user intent or external factors.
17. Which user group might benefit most from heatmaps in e-commerce?
A. Marketing teams for ad campaigns
B. UX designers for product page layouts
C. IT departments for security
D. Sales teams for phone calls
Answer: B
Explanation: UX designers use heatmaps to optimize product pages by identifying which items users view or add to carts, enhancing the shopping experience.
18. How can heatmaps be integrated with other tools for better insights?
A. By combining with CRM software
B. By linking with session recordings
C. By syncing with email lists
D. By connecting to weather apps
Answer: B
Explanation: Integrating heatmaps with session recordings provides a fuller picture of user behavior, showing not just clicks but the context of actions.
19. What best practice should be followed when using heatmaps?
A. Analyze data in isolation
B. Collect data from a diverse user sample
C. Ignore low-activity areas
D. Use only one type of heatmap
Answer: B
Explanation: Gathering data from a varied audience ensures accurate insights, avoiding biases from a single demographic.
20. Why are heatmaps considered essential for iterative website design?
A. They provide static images only
B. They offer real-time feedback on user behavior for ongoing improvements
C. They eliminate the need for testing
D. They focus solely on aesthetics
Answer: B
Explanation: Heatmaps deliver actionable data on user interactions, allowing designers to make iterative changes based on actual behavior patterns.
or
Part 3: Automatically generate quiz questions using OnlineExamMaker AI Question Generator
Automatically generate questions using AI