Being able to create a quiz efficiently and easily in a single platform is one thing, but having the option to analyze quiz data from the quiz that you made is another level! Nowadays, there are several platforms and websites that you can use to create and share quizzes with your students or peers. Still, not all of them offer amazing features like analyzing the data from the quizzes such as Microsoft Forms. It has a fully-fledged grading system through which users can award points to each question for students, and further provide feedback in different modes. Export your quiz results to Microsoft Excel for detailed analysis and visualization; manage responses by deleting or printing a summary of all submissions. How? Let us show you!
- How to Analyze Quiz Data from Microsoft Forms?
- OnlineExamMaker: Best Alternative Way to Access and Analyze Quiz Data
- How to Analyze Quiz Data in OnlineExamMaker Platform?
How to Analyze Quiz Data from Microsoft Forms?
Check Quiz Results
To check the results of a quiz in Microsoft Forms, open the quiz you want to grade and click on the Responses tab.
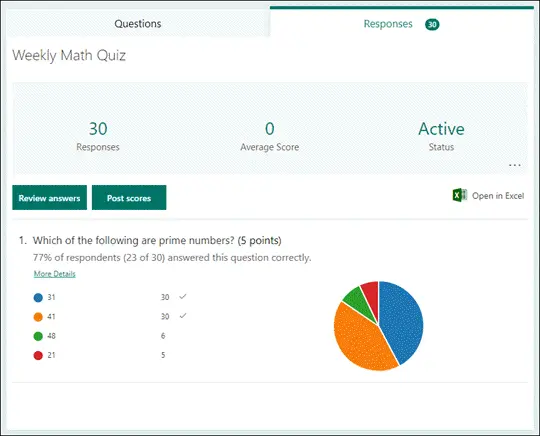
On top of the results, summary information is given about your quiz live, like the total number of responses and the average score. Each question has a count of responses and a chart to represent how these responses are distributed among the options available.
Select the More options button to delete all responses, print a summary, or get a summary link to share with others.

Click the Review answers button to view and analyze the answers of the students. You can choose to review the answers Per person or Per question.
Analyze Your Quiz Results in Excel
You can easily view all of the response data for your quiz in Microsoft Excel. On the Responses tab click Open in Excel.
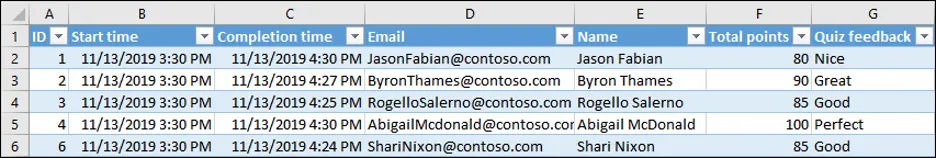
Every question in your quiz and the answer to them in your Excel workbook is represented under columns, whereas every response is represented in a row. The first five columns display the IDs of the respondents, start and completion times for the response, name, and email address of the student. Columns after that exhibit total points, quiz feedback, grade posted time, quiz questions, points for individual questions, and feedback for individual questions.
These are just some of the common ways how to Analyze Quiz Data from Microsoft Forms. However, by just simply accessing the responses and the quiz results, you can do a lot more with it, especially with the option of opening it on Excel. What if you are not into using Microsoft Forms, is there any other platform that you can use? There is! It’s the famous OnlineExamMaker. Let’s know more ab
out it!
OnlineExamMaker: Best Alternative Way to Access and Analyze Quiz Data

Aside from using Microsoft Forms in Analyzing your quiz data, OnlineExamMaker has an all-inclusive feature package that will not only match but also go beyond most of those offered by Microsoft Forms. One of the strengths of OnlineExamMaker is effectively organizing groups within educational settings. It allows educators to create tasks and monitor progress to achieve student collaboration to optimize group dynamics. We will see below the methodologies that help you analyze quiz data using OnlineExamMaker, demonstrating powerful capabilities in an educational view. Let me show you the ways on how to do it.
Create Your Next Quiz/Exam with OnlineExamMaker
How to Analyze Quiz Data in OnlineExamMaker Platform?
With OnlineExamMaker, you can easily create a professional online quiz to collect feedbacks from quiz takers. The software offer AI grading tool which can generate quiz reports and helpful insights automatically. Below is the tutorial about how to analyze quiz data in OnlineExamMaker.
Go to “All Exams” under “Exams”, click “Statistics” of the exam, then detailed analysis data can be seen, including Basic Analysis, Exam Questions Analysis, Collect Information Analysis, and Category Statistics.
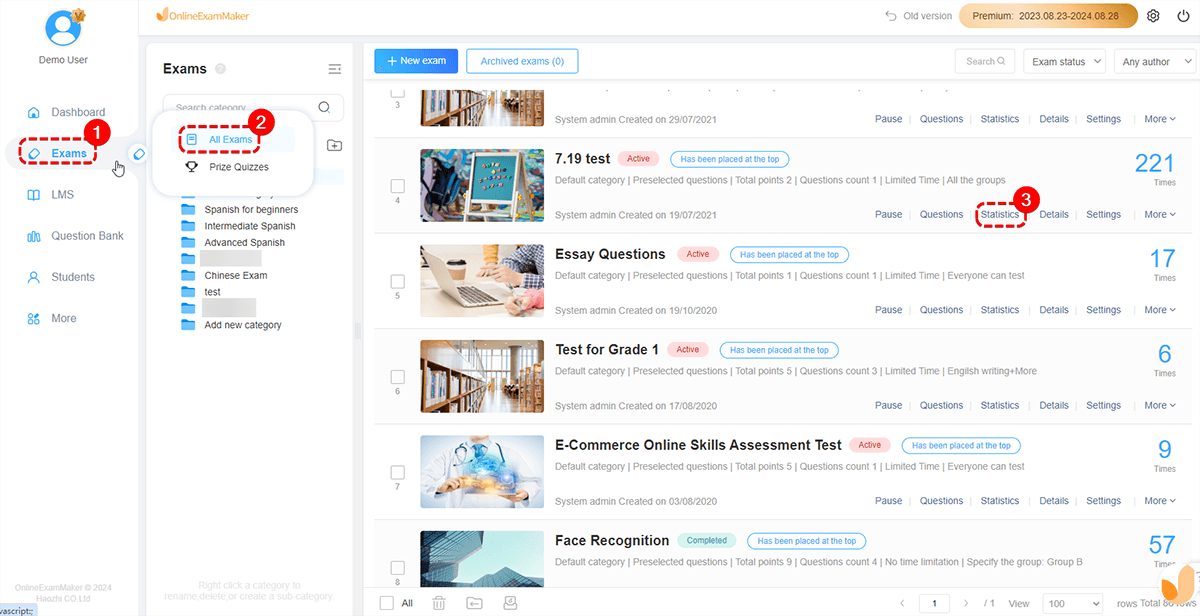
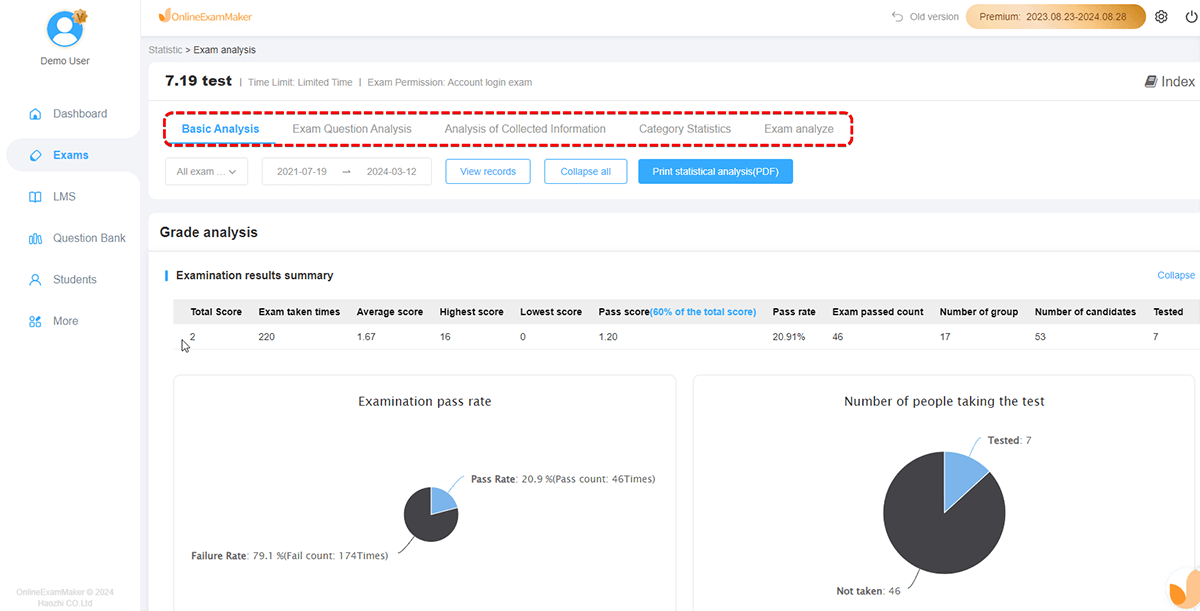
What makes OnlineExamMaker amazing is how these four options offers different way you can view the detailed data and analyze them easily! Why don’t I show you their differences.
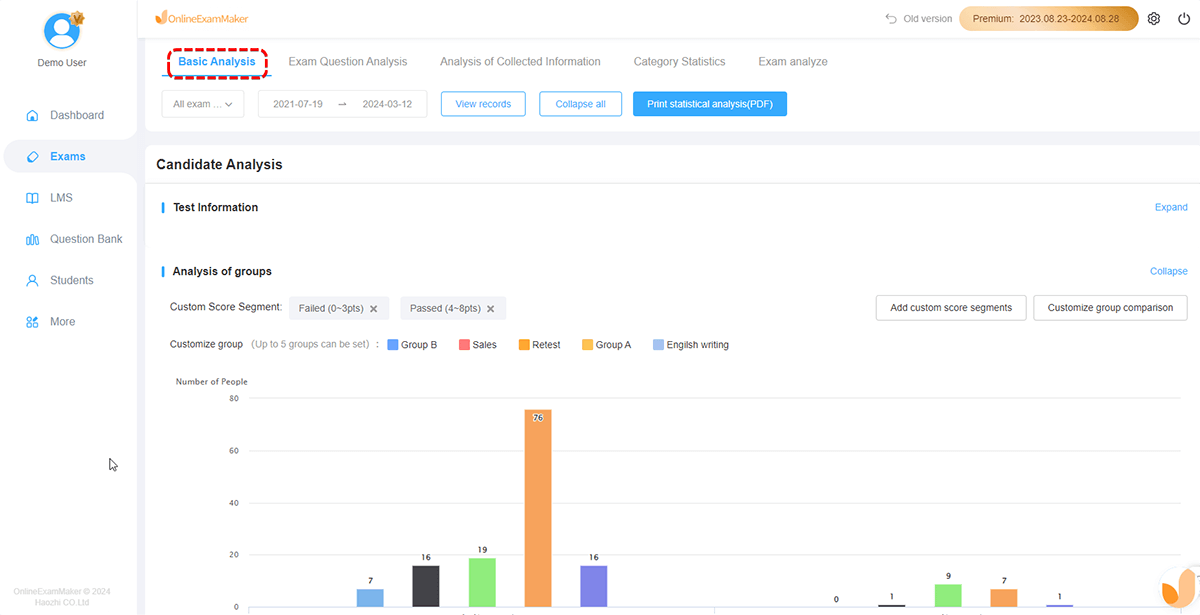
Basic Analysis
Basic Analysis includes
• Examination results summary (pass percentage, average score, etc.)
• Score segment statistical analysis (Users can customize a certain score segment, and the system displays data in a histogram.)
• Statistical analysis of classification (Number of questions, score, correct answer rate, etc. of each category will be displayed in table format.)
• Question correct rate, error rate.
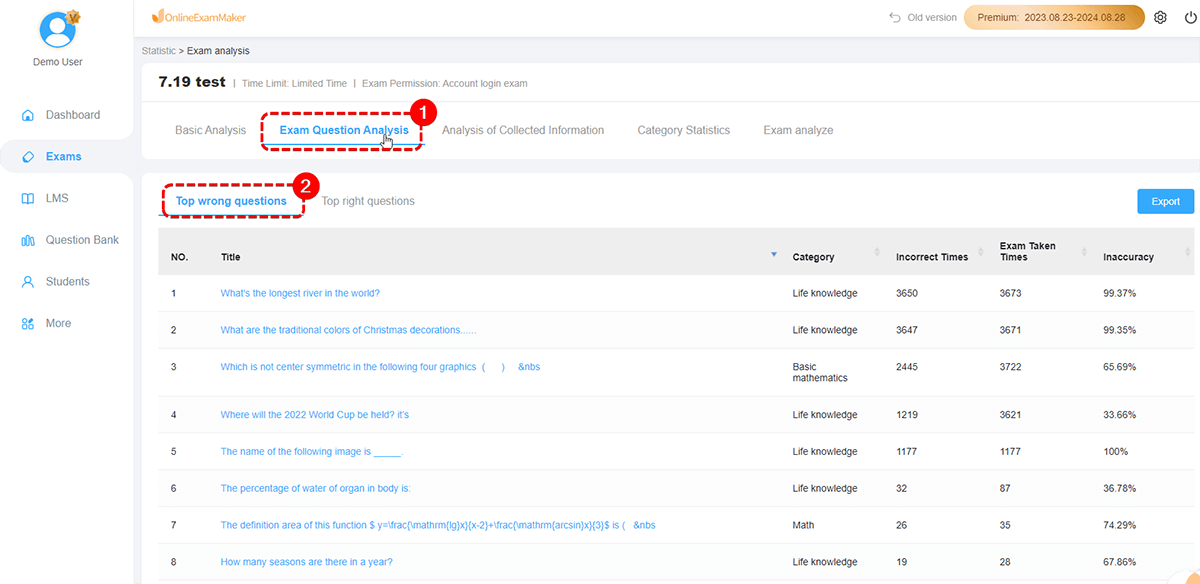
Exam Questions Analysis
Demonstrate the ranking analysis of the error rate of the test questions.
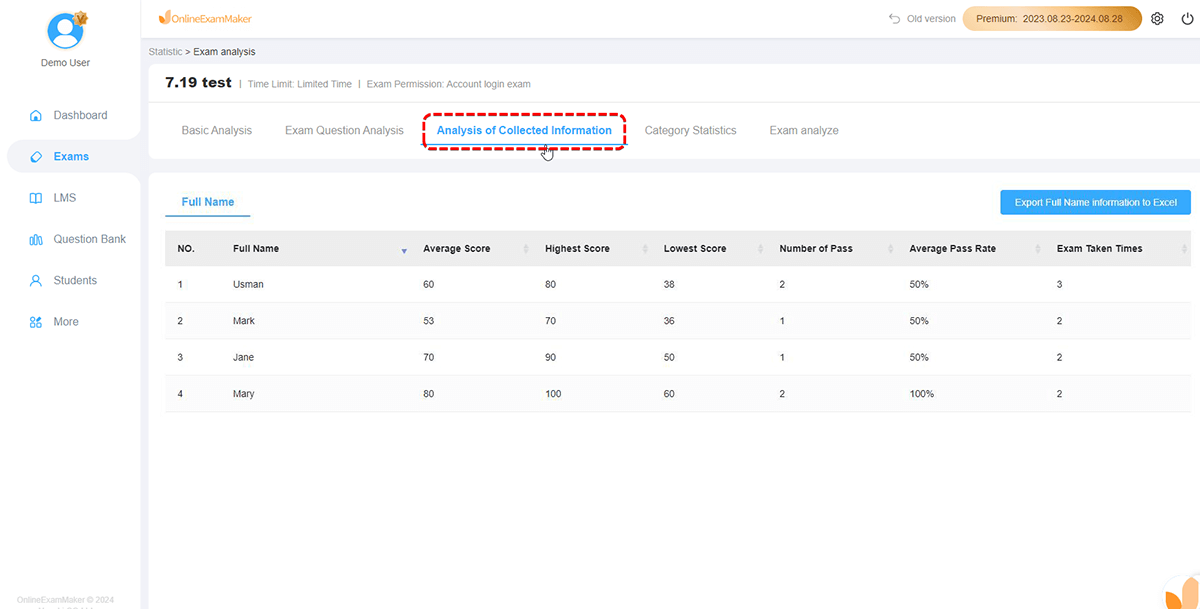
Collect Information Analysis
Analyze the candidate’s average score, lowest score, highest score, number of passes, etc. from the collected information of each candidate.
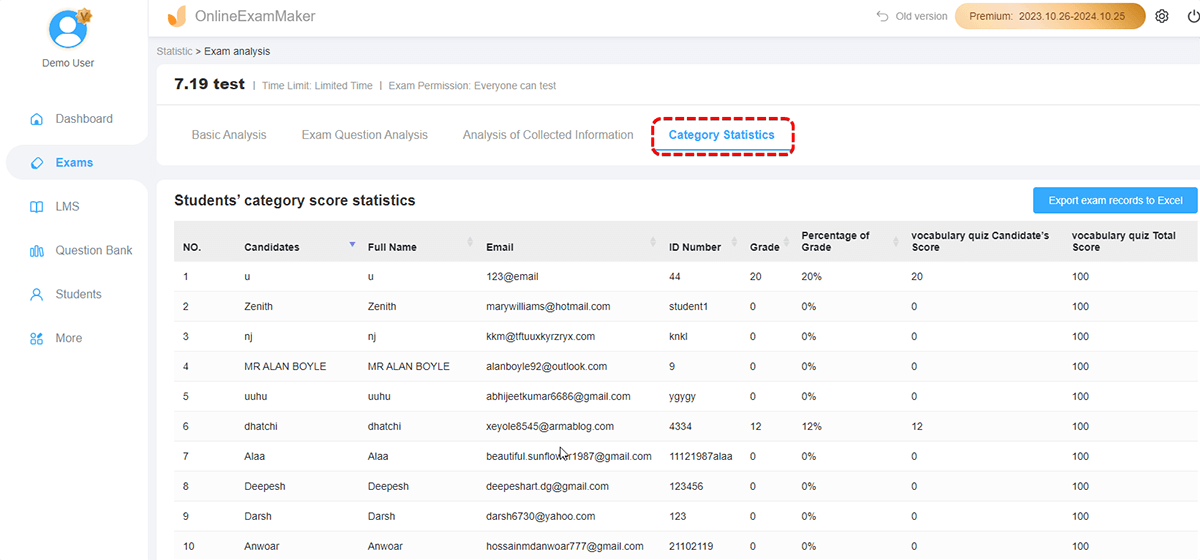
Category Statistics
Show the statistics of students’ category score.
While analyzing test data in educational settings, OnlineExamMaker is still much of an ultimate choice compared to Microsoft Forms. In comparison with Microsoft Forms, OnlineExamMaker goes further to offer educators a robust set of modules for educational assessment purposes. From detailed examination result summary reports to score segment analysis that is customizable and presented in visually informative histograms, OnlineExamMaker provides educators with deep insights into student performance. What differentiates it is its competency in data analysis and improving the group dynamics through increased collaboration among learners. It gives educators the ease of making class assignments, tracking progress, and creating engaging learning moments in class. With a user-friendly interface and specialized educational tools, OnlineExamMaker empowers educators to drive informed decisions toward student success and growth in academics.