The normal distribution, often called the Gaussian distribution, is a continuous probability distribution that forms a symmetric bell-shaped curve. It is characterized by its mean (μ), which represents the center of the distribution, and its standard deviation (σ), which indicates the spread of the data. In this distribution, data points are most concentrated around the mean, with the probability of values decreasing as they move further away in either direction. Due to its properties, such as the central limit theorem, it models many natural and social phenomena, including heights, test scores, and measurement errors. The curve is defined by the probability density function:
\[ f(x) = \frac{1}{\sigma \sqrt{2\pi}} e^{-\frac{(x – \mu)^2}{2\sigma^2}} \]
This makes it a cornerstone of statistical analysis, where approximately 68% of data falls within one standard deviation of the mean, 95% within two, and 99.7% within three.
Table of contents
- Part 1: OnlineExamMaker – Generate and share normal distribution quiz with AI automatically
- Part 2: 20 normal distribution quiz questions & answers
- Part 3: Automatically generate quiz questions using AI Question Generator
Part 1: OnlineExamMaker – Generate and share normal distribution quiz with AI automatically
The quickest way to assess the normal distribution knowledge of candidates is using an AI assessment platform like OnlineExamMaker. With OnlineExamMaker AI Question Generator, you are able to input content—like text, documents, or topics—and then automatically generate questions in various formats (multiple-choice, true/false, short answer). Its AI Exam Grader can automatically grade the exam and generate insightful reports after your candidate submit the assessment.
What you will like:
● Create a question pool through the question bank and specify how many questions you want to be randomly selected among these questions.
● Allow the quiz taker to answer by uploading video or a Word document, adding an image, and recording an audio file.
● Display the feedback for correct or incorrect answers instantly after a question is answered.
● Create a lead generation form to collect an exam taker’s information, such as email, mobile phone, work title, company profile and so on.
Automatically generate questions using AI
Part 2: 20 normal distribution quiz questions & answers
or
1. Question: What is the shape of a normal distribution curve?
A) Skewed right
B) Skewed left
C) Symmetrical and bell-shaped
D) Uniform
Answer: C
Explanation: A normal distribution is defined by its symmetrical bell-shaped curve, where data is evenly distributed around the mean.
2. Question: In a normal distribution, what percentage of data falls within one standard deviation of the mean?
A) 50%
B) 68%
C) 95%
D) 99.7%
Answer: B
Explanation: According to the empirical rule, approximately 68% of the data in a normal distribution lies within one standard deviation of the mean.
3. Question: What does the mean represent in a normal distribution?
A) The peak of the curve
B) The spread of the data
C) The minimum value
D) The maximum value
Answer: A
Explanation: In a normal distribution, the mean is at the center and represents the peak of the bell-shaped curve.
4. Question: If a dataset follows a normal distribution with mean 50 and standard deviation 10, what is the z-score for a value of 60?
A) 0.5
B) 1
C) 1.5
D) 2
Answer: B
Explanation: The z-score is calculated as (value – mean) / standard deviation = (60 – 50) / 10 = 1.
5. Question: Which of the following is a characteristic of the standard normal distribution?
A) Mean of 0 and standard deviation of 1
B) Mean of 1 and standard deviation of 0
C) Mean of 0 and standard deviation of 0
D) Any mean and standard deviation
Answer: A
Explanation: The standard normal distribution is a special case with a mean of 0 and a standard deviation of 1.
6. Question: In a normal distribution, the total area under the curve equals:
A) 0
B) 0.5
C) 1
D) The mean value
Answer: C
Explanation: The total probability under the normal distribution curve is always 1, representing 100% of the data.
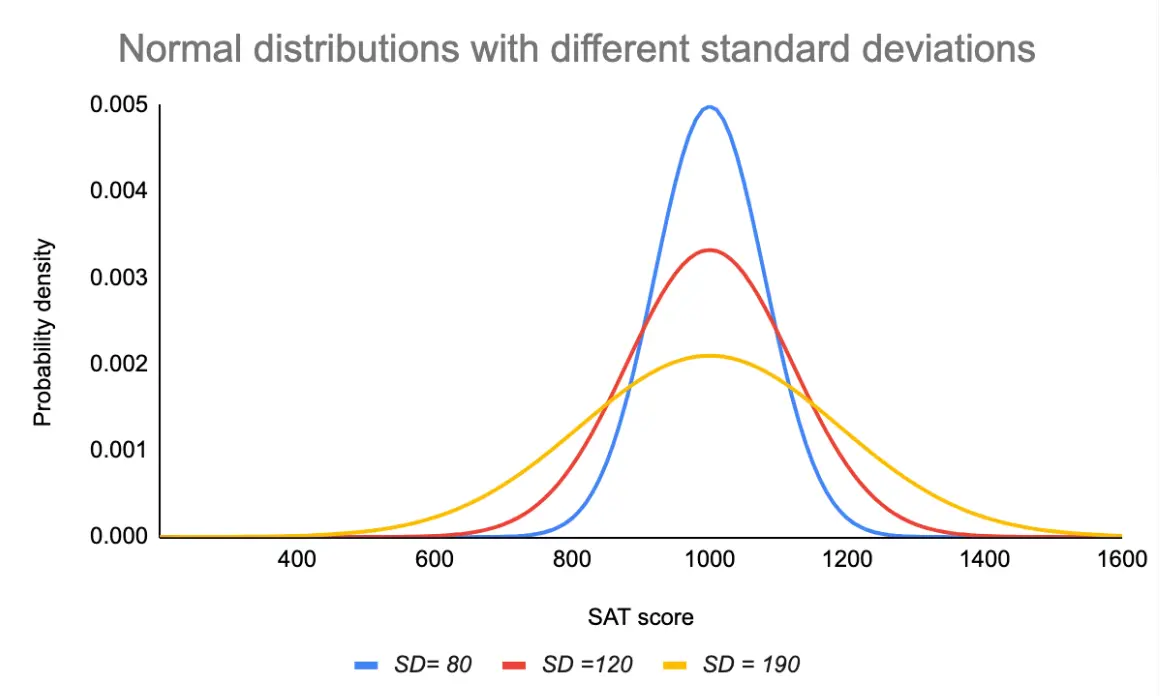
7. Question: What happens to the normal distribution curve if the standard deviation increases?
A) It becomes taller and narrower
B) It becomes shorter and wider
C) It shifts to the right
D) It shifts to the left
Answer: B
Explanation: A larger standard deviation indicates more spread, making the curve wider and flatter.
8. Question: For a normal distribution, the probability of a value being exactly equal to the mean is:
A) 0
B) 0.5
C) 1
D) Equal to the standard deviation
Answer: A
Explanation: In a continuous normal distribution, the probability of any exact value is zero because it is a density function.
9. Question: If a normal distribution has a mean of 100 and standard deviation of 15, approximately what percentage of data is between 70 and 130?
A) 68%
B) 95%
C) 99.7%
D) 50%
Answer: B
Explanation: This range is within two standard deviations (100 ± 30), so about 95% of the data falls here per the empirical rule.
10. Question: What is the purpose of the z-score in normal distributions?
A) To standardize data
B) To calculate the mean
C) To find the median
D) To determine skewness
Answer: A
Explanation: Z-scores standardize values by expressing them in terms of standard deviations from the mean.
11. Question: In a normal distribution, the mode is:
A) Always less than the mean
B) Always greater than the mean
C) Equal to the mean
D) Equal to the standard deviation
Answer: C
Explanation: In a normal distribution, the mean, median, and mode are all equal at the center of the curve.
12. Question: If the mean of a normal distribution is 20 and the standard deviation is 5, what value corresponds to a z-score of -2?
A) 10
B) 15
C) 20
D) 25
Answer: A
Explanation: The value is calculated as (z-score × standard deviation) + mean = (-2 × 5) + 20 = 10.
13. Question: Which theorem states that the distribution of sample means approaches a normal distribution as sample size increases?
A) Law of Large Numbers
B) Central Limit Theorem
C) Pythagorean Theorem
D) Binomial Theorem
Answer: B
Explanation: The Central Limit Theorem explains that the sampling distribution of means will be approximately normal for large samples.
14. Question: For a normal distribution, what is the interquartile range (IQR) in terms of standard deviations?
A) Approximately 0.67 standard deviations
B) Approximately 1.35 standard deviations
C) Approximately 2 standard deviations
D) Exactly 1 standard deviation
Answer: B
Explanation: The IQR spans from the 25th to 75th percentile, which is about 1.35 standard deviations in a normal distribution.
15. Question: If a normal distribution is positively skewed, what can be said about it?
A) It is not a normal distribution
B) Normal distributions are never skewed
C) It has a longer tail on the right
D) It has a longer tail on the left
Answer: A
Explanation: A true normal distribution is perfectly symmetrical and not skewed; skewness indicates a non-normal distribution.
16. Question: In a standard normal distribution, what is the probability that a value is greater than 1?
A) 0.1587
B) 0.3413
C) 0.8413
D) 0.5
Answer: A
Explanation: The area to the right of z = 1 is 1 – 0.8413 = 0.1587, based on standard normal tables.
17. Question: How does changing the mean affect a normal distribution?
A) It changes the shape
B) It shifts the curve left or right
C) It affects the standard deviation
D) It makes the curve wider
Answer: B
Explanation: The mean determines the center of the distribution, so changing it shifts the entire curve without altering its shape.
18. Question: For a normal distribution with mean 0 and standard deviation 2, what is the probability density at x = 0?
A) 0
B) 0.5
C) 0.1995
D) 1
Answer: C
Explanation: The probability density function formula gives f(x) = (1 / (σ√(2π))) e^(-((x-μ)^2 / (2σ^2))), so at x=0, μ=0, σ=2, f(0) ≈ 0.1995.
19. Question: What is the variance of a standard normal distribution?
A) 0
B) 1
C) The mean
D) Undefined
Answer: B
Explanation: The standard normal distribution has a standard deviation of 1, so its variance is 1 squared, which is 1.
20. Question: In quality control, why is the normal distribution often used?
A) It models errors and variations symmetrically
B) It only applies to discrete data
C) It has no mean
D) It is always skewed
Answer: A
Explanation: Many natural processes produce data that follows a normal distribution, making it ideal for modeling variations like manufacturing errors.
or
Part 3: Automatically generate quiz questions using OnlineExamMaker AI Question Generator
Automatically generate questions using AI